KaLai Tsang, BS, Shivayogi V. Hiremath, PhD, Dan Ding, PhD
Department of Rehabilitation Science and Technology, University of Pittsburgh, Pittsburgh, PA 15260
Human Engineering Research Laboratories, Department of Veterans Affairs, Pittsburgh, PA 15206
ABSTRACT
There is an increasing demand for a reliable activity monitoring device to help manual wheelchair users track their everyday physical activities. In this study, we evaluated the performance of custom activity-specific energy expenditure prediction models that were recently developed for a commercial multi-sensor based activity monitor, SenseWear armband, for manual wheelchair users with spinal cord injuries. We compared the accuracies of the custom prediction models and the default models used by the SenseWear device in predicting energy expenditure of four types of physical activities to the criterion values by a portable metabolic cart. Results showed the new prediction models had an average error of 21.4±1.11% in estimating the energy expenditure while the default models used by the SenseWear had an average error of 45.5±2.21%. In addition, the prediction models had a higher intra-class correlation coefficient with the criterion measure (0.858) than the SenseWear (0.763), suggesting that manual wheelchair users could use the custom prediction models with the SenseWear device to more accurately track their physical activities.
BACKGROUND
The use of activity monitors as an assessment tool to self-monitor the amount and the intensity of the physical activities (PA) has become popular in the general population. Studies have shown that activity monitors are accurate in tracking the energy expenditure (EE) and classifying activities of users on a daily basis [5]; these devices also showed potentials in encouraging users to develop/keep a healthier lifestyle by promoting regular PA [3][6]. Manual wheelchair users (MWUs) who lead a sedentary lifestyle can potentially utilize this technology to gauge their PA and EE. These individuals face greater physical limitations and physiological constraints such as relatively small muscle mass that is under voluntary control, deficient cardiovascular reflex responses, and decreased blood circulation in legs, and thus are often less active and engage in fewer rigorous PA [7]. As a result, this population has higher risk of developing cardiovascular disease and other health problems [4]. Activity monitors that provide real-time EE feedback can potentially increase MWUs’ awareness of their PA and help them control and regulate their body weight.
According to previous studies, none of the commercial activity monitors are accurate in estimating the EE in MWUs [5][6][7][8]; most of the devices are designed to track lower limbs movements, which is ineffective for MWUs who rely on their upper limbs as a primary means of mobility for daily tasks. A more accurate and reliable assessment tool is needed for the MWUs to quantify their PA. Researchers have recently developed custom activity-specific EE prediction models for the MWUs with spinal cord injury (SCI) based on a commercial activity monitor, i.e., SenseWear armband (Bodymedia Inc., Pittsburgh, PA) [4]. The purpose of this study is to evaluate the performance of the custom EE prediction models, and compare their performance with the default models used by the SenseWear. We hypothesized that the new custom EE prediction models would provide a more accurate and reliable estimation of EE for MWUs with SCI.
METHOD
The study was approved by the Institutional Review Board at the University of Pittsburgh.
Subjects
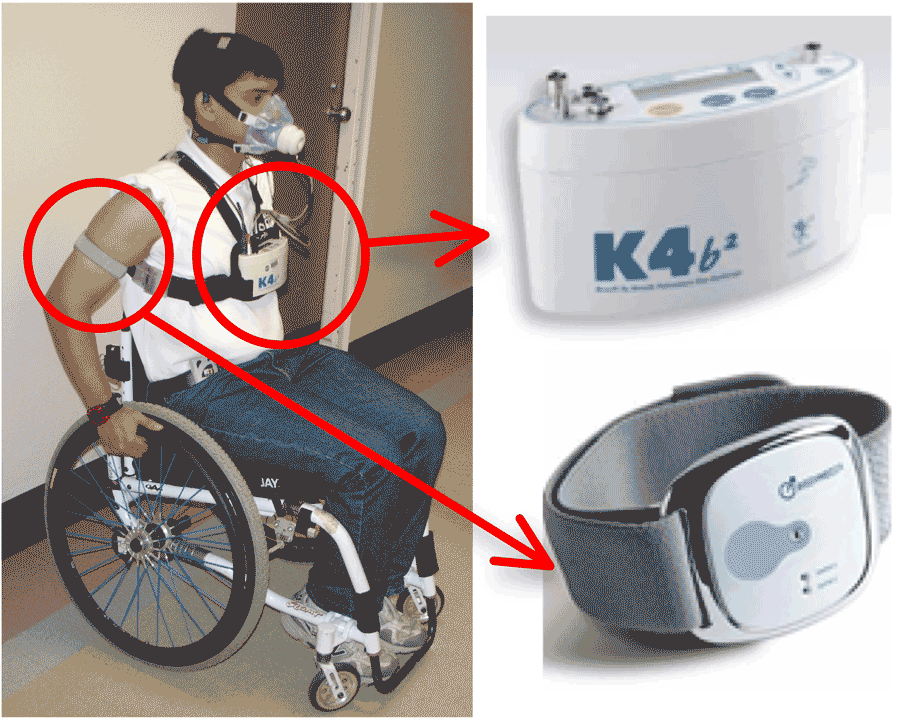 Figure 1: Each participant wore the metabolic cart K4b2 device (right top) at the chest area and a facial mask and the SenseWear armband (right bottom) on the dominant arm while performing each activity.
Forty-five subjects with SCI were recruited. Subjects were between 18 and 60 year-old, used manual wheelchairs as a primary mean of mobility, had an SCI, were at least six months post-injury, and were able to use an arm-ergometer for exercise.
Instrumentation
The SenseWear armband (SW) and a K4b2 portable metabolic cart (COSMED srl, Rome, Italy) were worn by participants while performing four activities including resting, deskwork, wheelchair propulsion, and arm ergometry (Figure 1). The EE measured by the K4b2 was served as a criterion. The estimation EE was based on the custom activity-specific models recently developed by the authors [4].
Activity-Specific Energy Expenditure Prediction Models [4]
The activity-specific EE prediction models shown below used the demographics and acceleration information collected by the commercial SW.
| EE |
Eq. 1 |
|---|---|
| EE |
Eq. 2 |
| EE |
Eq. 3 |
| EE |
Eq. 4 |
| Variables | Descriptions |
|---|---|
| EE | Predicted energy expenditure |
| a | Height divided by the mean absolute deviation in longitudinal acceleration |
| b | Mean absolute deviation in longitudinal acceleration |
| c | Body mass |
| d | Average transverse acceleration |
| e | Average number of peaks per minute in longitudinal acceleration |
| f | Product of mean absolute deviation in transverse and longitudinal acceleration |
Procedures
The study was explained to the subjects, and written consent forms were obtained from them prior to participating in the study. Subjects were first asked to complete a basic demographic questionnaire and had their weight, height, and skinfold thickness at biceps, triceps, subscapular and suprailiac measured. The body fat percentage of subjects was calculated based on the average skinfold measurement. After that, subjects were asked to perform four activities: resting, deskwork, wheelchair propulsion, and arm ergometry at three locations: National Veterans Wheelchair Games 2012 (NVWG), Human Engineering Research Laboratories (HERL), and subject’s home (HOME). The wheelchair propulsion was divided into four trials: propulsion at a comfortable pace on carpet, propulsion at a self-selected slow speed, propulsion at a self-selected fast speed, and propulsion at a comfortable pace up and down on ramp surfaces. Subjects were asked to perform each activity trial for at least 6 minutes with a 5 to 10 minutes break between each trial and a 30 minutes break between each activity.
Data Analysis
The data from the K4b2 and the SW was analyzed using MATLAB (R2013a, The Mathworks Inc.). The estimated EE for resting, deskwork, wheelchair propulsion, and arm ergometry were then calculated using corresponding equations 1 – 4. The estimated EE by the custom prediction models and the default EE outputs from the SW were both compared to the EE measured by the K4b2. Average percent difference (APD) of EE for each activity was computed using equation 5. The intra-class correlation coefficient (ICC) with absolute measure was used to examine the agreement between the estimated EE by the custom models and the default models used by the SW, respectively, and criterion EE (IBM SPSS Statistics 21.0). Results were presented in mean ± standard error. The mean and the difference of the estimated EE and the criterion for the custom prediction models and the SW were also computed to construct the Bland-Altman plots which provide a visual analysis of the agreement between the estimated and criterion values.
| APD = (EE |
Eq. 5 |
|---|
RESULTS
Accuracy
The APD between the K4b2 and the default models used by the SW, and between the K4b2 and the custom prediction models for the four activities were calculated, as shown in Table 2. The overall APD between the K4b2 and the default models used by the SW was 45.5±2.21% while that for the custom prediction models was 21.4±1.11%. In addition, the default models had a wider range of APD compared to the new prediction models. The APD between the K4b2 and the default models used by the SW ranged from -6.29±1.50% (resting at home) to 93.8±2.64% (slow propulsion at NVWG); while the APD of the EE estimated by the new prediction models ranged from -24.6±6.71% (propulsion on ramp surfaces at home) to 50.2±1.70% (arm ergometry at NVWG).
Consistency or reliability
The intra-class correlation coefficient (ICC) was used to evaluate the agreement between the K4b2 and the new prediction model, and between the K4b2 and the defaulted models used by the SW. The ICC between the K4b2 and the default models used by the SW was 0.763 (95% c.i.: 0.307 – 0.888); while the ICC between the K4b2 and the new custom prediction models was 0.858 (95% c.i.: 0.825 – 0.886). Higher ICC between the K4b2 and the custom prediction models suggests the estimated EE by the custom models to a greater extent agree with criterion by the K4b2.
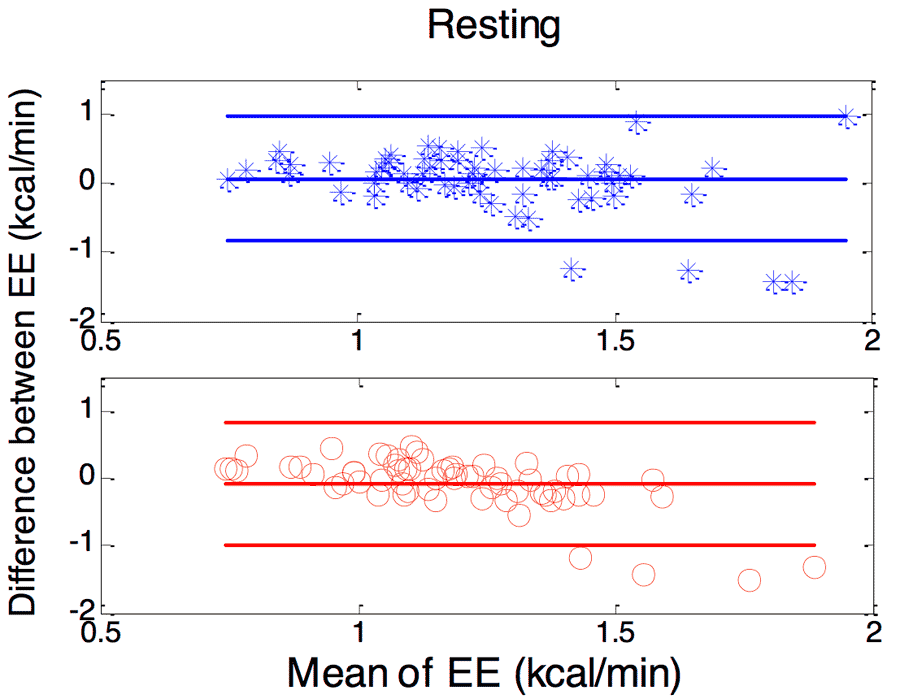 Figure 2Figure 3
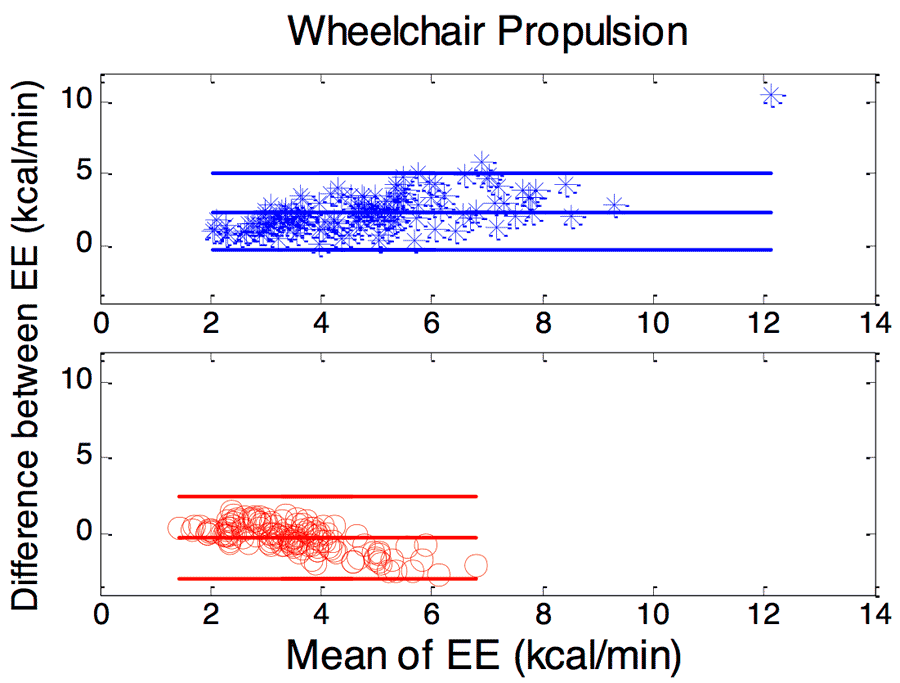 Figure 4
 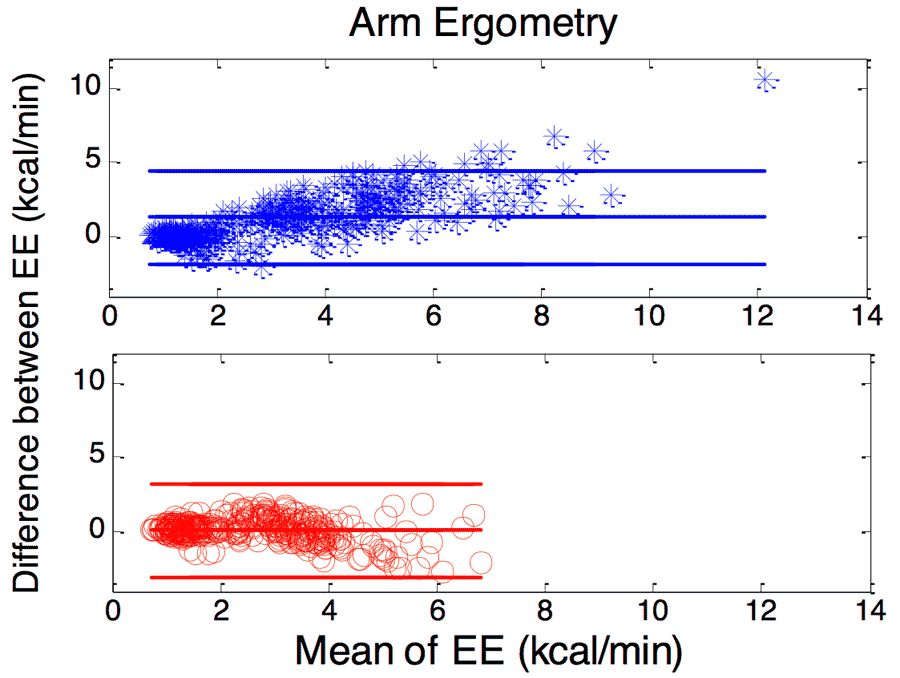 Figure 5
 Figure 2 – 5: Bland-Altman plots of comparisons of EE between K4b2 and the SenseWear (top graph with blue stars), and K4b2 and the prediction model (bottom graph with red circles) for resting, deskwork, wheelchair propulsion and arm ergometry. The mean was computed by averaging the estimated and criterion EE; while the difference was calculated by subtracting the criterion EE from the estimated EE.
Bland Altman plots were also created to illustrate how well the estimated EE by the default models and by the new custom prediction models agree with the criterion EE (Figure 2 – 5). The new custom prediction models were more reliable than the default models used by the SW; the EE estimated by the new prediction models were more consistent and had smaller difference when compared with the criterion while the EE estimated by the default models used by the SW were more spread out and had larger difference from the criterion.
| Activity | Location | SenseWear | Prediction | |
|---|---|---|---|---|
| Resting | NVWG | 14.4±1.59 | 7.19±1.40 | |
| HERL | 25.8±0.995 | 9.29±0.717 | ||
| HOME | -6.29±1.50 | -18.4±1.29 | ||
| Deskwork | NVWG | 30.1±2.36 | 32.7±2.16 | |
| HERL | 27.5±1.19 | 30.3±1.02 | ||
| HOME | 21.3±1.20 | 19.4±1.27 | ||
| Arm Ergometry | NVWG | 70.7±3.91 | 50.2±1.70 | |
| HERL | 25.8±1.30 | 15.2±0.930 | ||
| Wheelchair Propulsion | Carpet | NVWG | 56.0±2.57 | -17.6±1.95 |
| HERL | 75.1±8.53 | 3.22±3.37 | ||
| HOME | 17.0±0 | -20.4±0 | ||
| Fast | NVWG | 91.7±2.44 | -7.69±1.37 | |
| HERL | 70.8±1.47 | -6.89±0.803 | ||
| HOME | 66.2±10.3 | 2.49±5.51 | ||
| Slow | NVWG | 93.8±2.64 | 16.4±1.93 | |
| HERL | 85.6±1.22 | 19.8±0.767 | ||
| HOME | 61.9±9.83 | 6.90±2.00 | ||
| Ramp Surfaces | HERL | 46.5±1.14 | -11.5±0.771 | |
| HOME | 11.2±5.97 | -24.6±6.71 | ||
DISCUSSION
Overall, the APD of new custom activity-specific EE prediction models averaged around 20%, except for the arm ergometry activity at NVWG. The relatively large discrepancy between the estimated EE and the criterion EE for the arm ergometer trial at NVWG might be due to the use of a different brand of arm ergometer at the NVWG from at HERL. The custom prediction models were developed based on the data collected from the arm ergometer at HERL.
Considering the four Bland-Altman plots (Figure 2 – 5), the new prediction models performed better than the default models used by the SW in activities with intermediate to high intensities, i.e., wheelchair propulsion and arm ergometry. In addition, the commercial SW tended to largely overestimate the EE and exceeded two standard deviations while the new custom prediction models tended to slightly underestimate the EE within two standard deviations. These show the prediction models were more concise and reliable in estimating EE than the SW in MWUs with SCI for these four basic activities. Although the custom prediction models were initially developed based on data collected in the controlled lab environment (HERL), they estimated EE reasonably well in activities took place in the semi-structured environment (NVWG) and the unstructured environment (HOME).
Study Limitations
One of the limitations of the current prediction models is that they are unable to predict isometric muscle activity, making the EE estimation almost always lower than the criterion. Furthermore, the new models are only designed for four basic activities in MWUs with SCI; it might not be accurate and reliable for MWUs with other diagnoses and/or performing other activities. Further work will focus on extending their applicability for a range of lifestyle and sporting activities among MWUs with various diagnoses.
CONCLUSION
The new activity-specific EE prediction models significantly improve the accuracy of a commercial activity monitor (i.e., SenseWear armband) in estimating the EE for resting, deskwork, wheelchair propulsion, and arm ergometry in MWUs with SCI. The use of the new prediction models could potentially facilitate self-monitoring of the PA and encourage MWUs to lead a healthy lifestyle. Although the new prediction models are only applicable in a subgroup of MWUs community, they serve as stepping stones for further development of technology of similar kinds.
REFERENCES
[1] Kaye, H.S, Kang, T. and LaPlante, M.P. (2000), Mobility Device Use in the United States, Disability Statistics Report 14, Washington, DC: U.S. Department of Education, National Institue on Disability and Rehabilitation Research
[2] Myers, Jonathan (2003), Exercise and Cardiovascular Health, Circulation (107): e2 – e5, American Heart Association
[3] Polzien, K.M., Jakicic, J.M. et al. (2007), The efficacy of a technology-related technology-based system in a short term behavioral weight-loss intervention, Obesity, 15(4): 825 – 830.
[4] Hiremath, Shivayogi, Ding, Dan, Farringdon, Johnathan, and Cooper, Rory A. (2012), Predicting Energy Expenditure of Manual Wheelchair Users with Spinal Cord Injury Using a Multisensor-Based Activity Monitor, Arch Phys Med Rehabil 2012; 93: 1937 – 1943.
[5] Jakicic, JM, Marcus M, Gallagher KI, Randall C, Thomas E, Goss FL, and Robertson RJ (2004), Evaluation of the SenseWear Pro armband to assess energy expenditure during exercise, Medicine & Science in Sports & Exercise, 36(5), 897 – 904.
[6] Ding, Dan, Hiremath, Shivayogi (2010), Utility of Common Monitoring Devices in Measuring Energy Expenditure in Manual Wheelchair Users with Spinal Cord Injury, Interactive Exercise Technologies and Exercise Physiology for Persons with Disabilities, P. 23 – 37.
[7] Hiremath, Shivayogi, Ding, Dan (2010), Evaluation of Activity Monitors in Estimating Energy Expenditure in Manual Wheelchair Users, RENSA Annual Conference, retrieved from: http://web.resna.org/library/conference_2010/Wheeled%20Mobility/Student%20Papers/HiremathS.html
[8] Chacon, Adriana, Hiremath, Shivayogi, Ding, Dan (2010), Evaluation of the RT3 Tri-axial Accelerometer to Measure Physical Activity in Manual Wheelchair Users with Spinal Cord Injury, RESNA Conference, retrieved from http://resna.org/conference/proceedings/2010/Word%20Versions/Mobility/StudentScientific/ChaconA.doc
ACKNOWLEDGMENT
The work is supported by the U.S. Department of Education’s National Institute of Disability and Rehabilitation Research (NIDRR) (Grant #H133E120005) and Department of Defense (W81XWH-10-1-0816). The work is also supported by the Human Engineering Research Laboratories, VA Pittsburgh Healthcare System. The contents do not represent the views of the Department of Veterans Affairs or the United States Government.
Audio Version PDF Version